The Process
(And the Outtakes)
Throughout my research, I found myself returning to the question with which we opened our summer as Digital Scholarship Interns:
“What is/are the Digital Humanities?”
I have done a few small-scale research projects before, but in controlled settings where we were walked through the process, from exploring the field of our research topic to writing a prospectus and developing a plan. After reading a blog post by Trevor Owens, a popular name in the world of Digital Humanities, I was utterly confused by the fluidity with which he characterized DH research. At that moment, I had assumed that the starting point for any project should always be the archive (or the preliminary research), followed by a well-informed question and then the appropriate tools. But as this narrative of my process will show, my assumptions were proven wrong.
In terms of the Edward and Orra Hitchcock Collection, I took an interest in Hitchcock’s “dueling passions” relatively early on in our exploration. In fact all of the interns took an interest (to varying degrees, of course) in his desire to reconcile what seemed like a contradictory pair of academic interests, especially in a time where the natural sciences were evolving so rapidly. How could the man who discovered “large bird tracks” in New England deny the theory of evolution? How could a pious theologian seek so passionately to uncover facts which could cast doubt upon his faith?
After reading a few sermons from Hitchcock’s Religious Lectures on Peculiar Phenomena in the Four Seasons as well as some of his other religious writings, I took an interest in examining the overlaps in how he spoke about science in the context of religion and vice versa. I read a thorough examination of Hitchcock’s religious thought in Stanley Guralnick’s Geology and Religion before Darwin: the Case of Edward Hitchcock Theologian and Geologist (1793-1864), and came up with a few ideas about what to do with all of the information I had learned, which veered a bit from my original plan. Guralnick explained that during Hitchcock’s time, many scholars were doing the same work of trying to align the sciences with the scripture, therefore while Hitchcock was challenged for a number of his views, these challenges didn’t weren’t launched in an effort to pressure Hitch to side with either science or religion.
We created preliminary project proposals, and the common theme of legacy and examining Hitchcock’s imprint on the world around him had emerged from the other three intern’s projects; this theme helped me to narrow down my possible research projects on his “dueling passions” to one– an analysis of Hitchcock’s place within the contemporary conversations.
Larger versions of all of the images are available in the gallery at the bottom of the page.

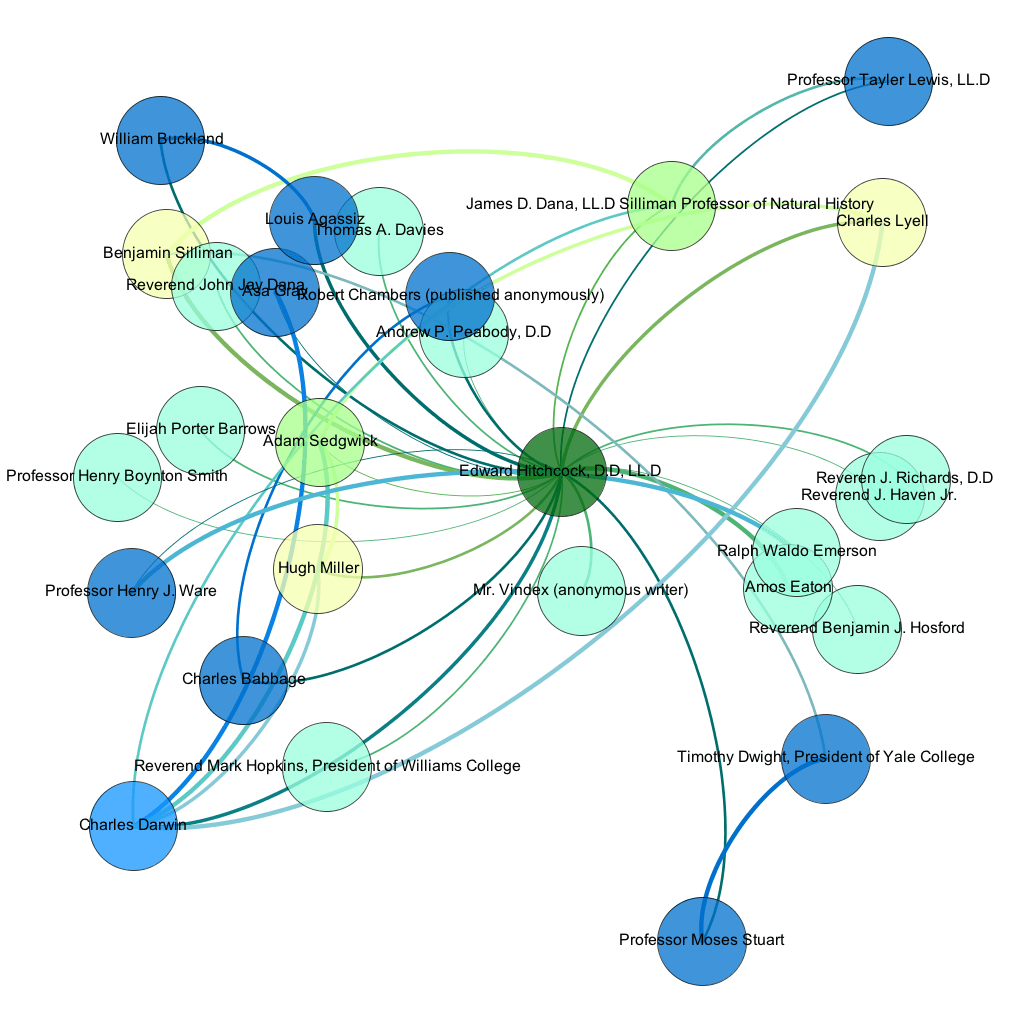
A Social Network Analysis visual spread out over a map.
That was the original goal. I quite literally wanted to map the conversations. Who was talking to who? What were each of the scholars’ views on one another’s work? Think Stanford’s visualization of the Republic of Letters.
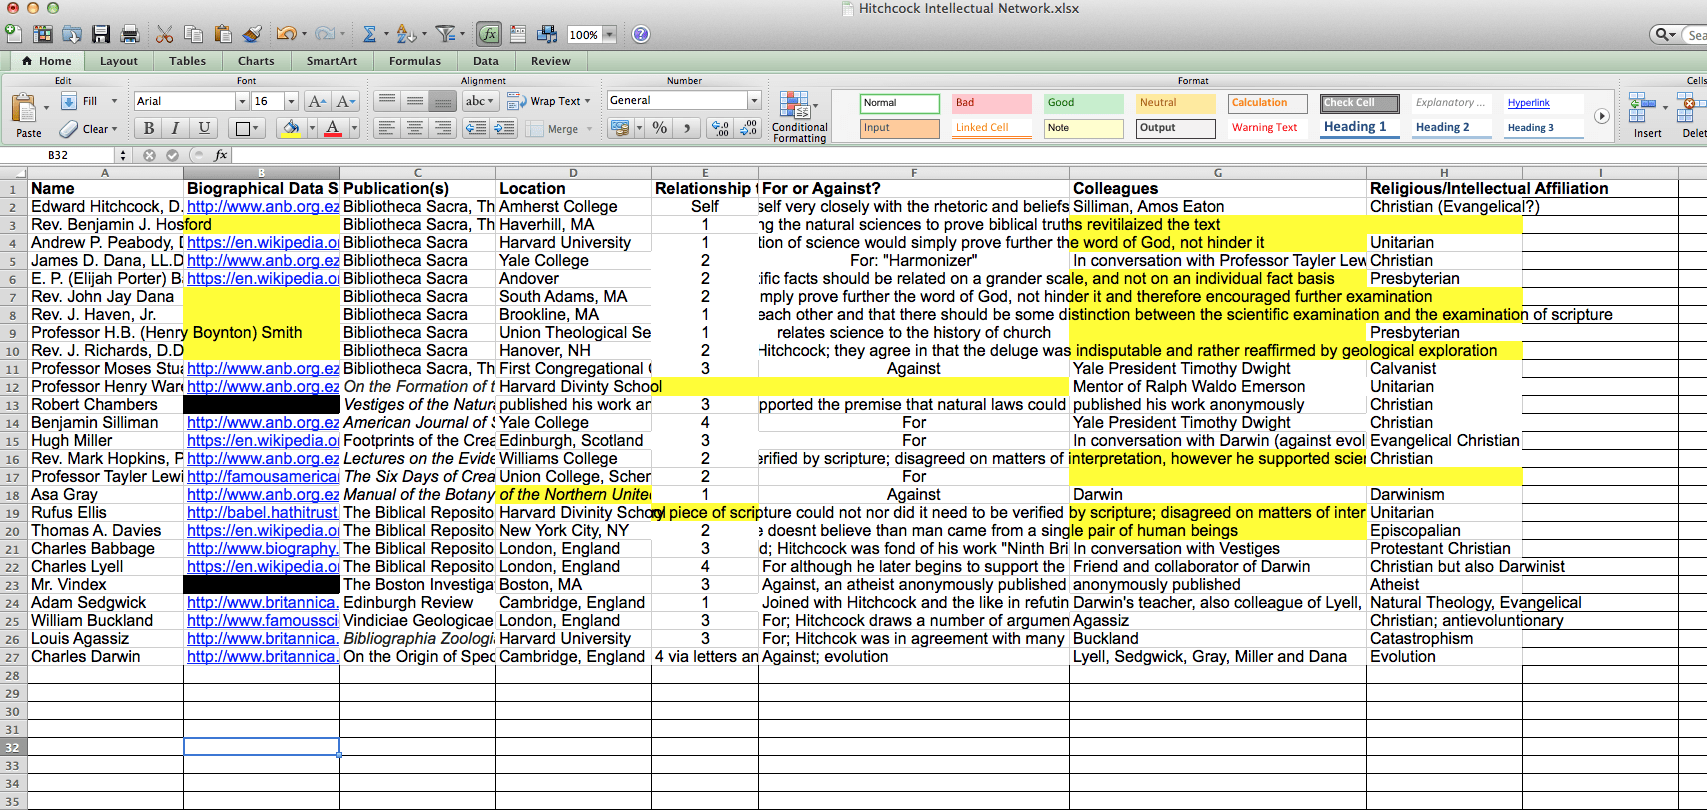
I began collecting data by looking at where Hitchcock was publishing his articles (thanks to some secondary source research, I had a few places to start) and gathering the names of scholars who were publishing about the same topics as Hitch during his time. (His time being from the year he was born until the year he died) By only looking at journals in which he had published, the scope of my project was narrowed down organically, without my having to go through and cherry-pick scholars based on some arbitrary thing like, how tired I was the day I was data mining or how pretty someone’s name was. I then gathered information about their dates of birth and death, various affiliations in terms of religion and intellectual camp, where and what they published, and who they were affiliated with. I also did some research to find out more about the nature of each individuals relationship to Hitchcock and to each other, ranking their relationships from 1-5 in order to visualize the connections.
The code for the relationships corresponded to what Gephi called the “weight” of an edge and was as follows:
The first visualization that I came up with was the screenshot to the right, made through Gephi. (very pretty, very cluttered) However, once I got to this point, it was simply a matter of making the information more intuitive, such as adjusting the nodes and edges so that they are clustered based on which other nodes they were connected to, and not just randomly spread out across the screen; color coding the nodes so that the color gradient aptly represented the “connectedness” as I like to describe it; and things as simple as making sure the labels are visible and don’t overlap.
Social network: √

Gephi had some installable plugins that would make it so my data was displayed geographically, so for continuity’s sake, I launched the second half of my attack using this plugin. I had to come up with a spreadsheet that had longitudes and latitudes in order to get that plugin to work, so I googled a location converter and began plugging in points. By this point, I’d had a number of spreadsheets already (see left for one of the prototypes) with different versions of Hitchcock’s names. (Hitch, Hitchy, Hitcho, HITCH2, HITCH_FINAL, etc) After several unsuccessful attempts at using the geo plugin for Gephi to show my data (partly because I have a relatively basic understanding of the software, and also because I was pressed for time) I decided to try a different software.
My perfect plan of a research project had broken down already. (and it hadn’t taken very long) Consequently, I decided to use Tableau for my geographic representation. What I came up with was, again pretty, but I didn’t feel as if the map was the best representation of all of the information that I had found. At one of our team meetings, a few of the librarians suggested capitalizing on all of the qualitative information I had gathered during my research, such as biographical information and details about the scholars various positions and writings. BOOM. My question changed. Because of the tools. My whole research philosophy confounded. Luckily, I had gathered most any information that I thought could be useful during my initial research period, so it was back to the drawing board, but not all the way back to the archive.

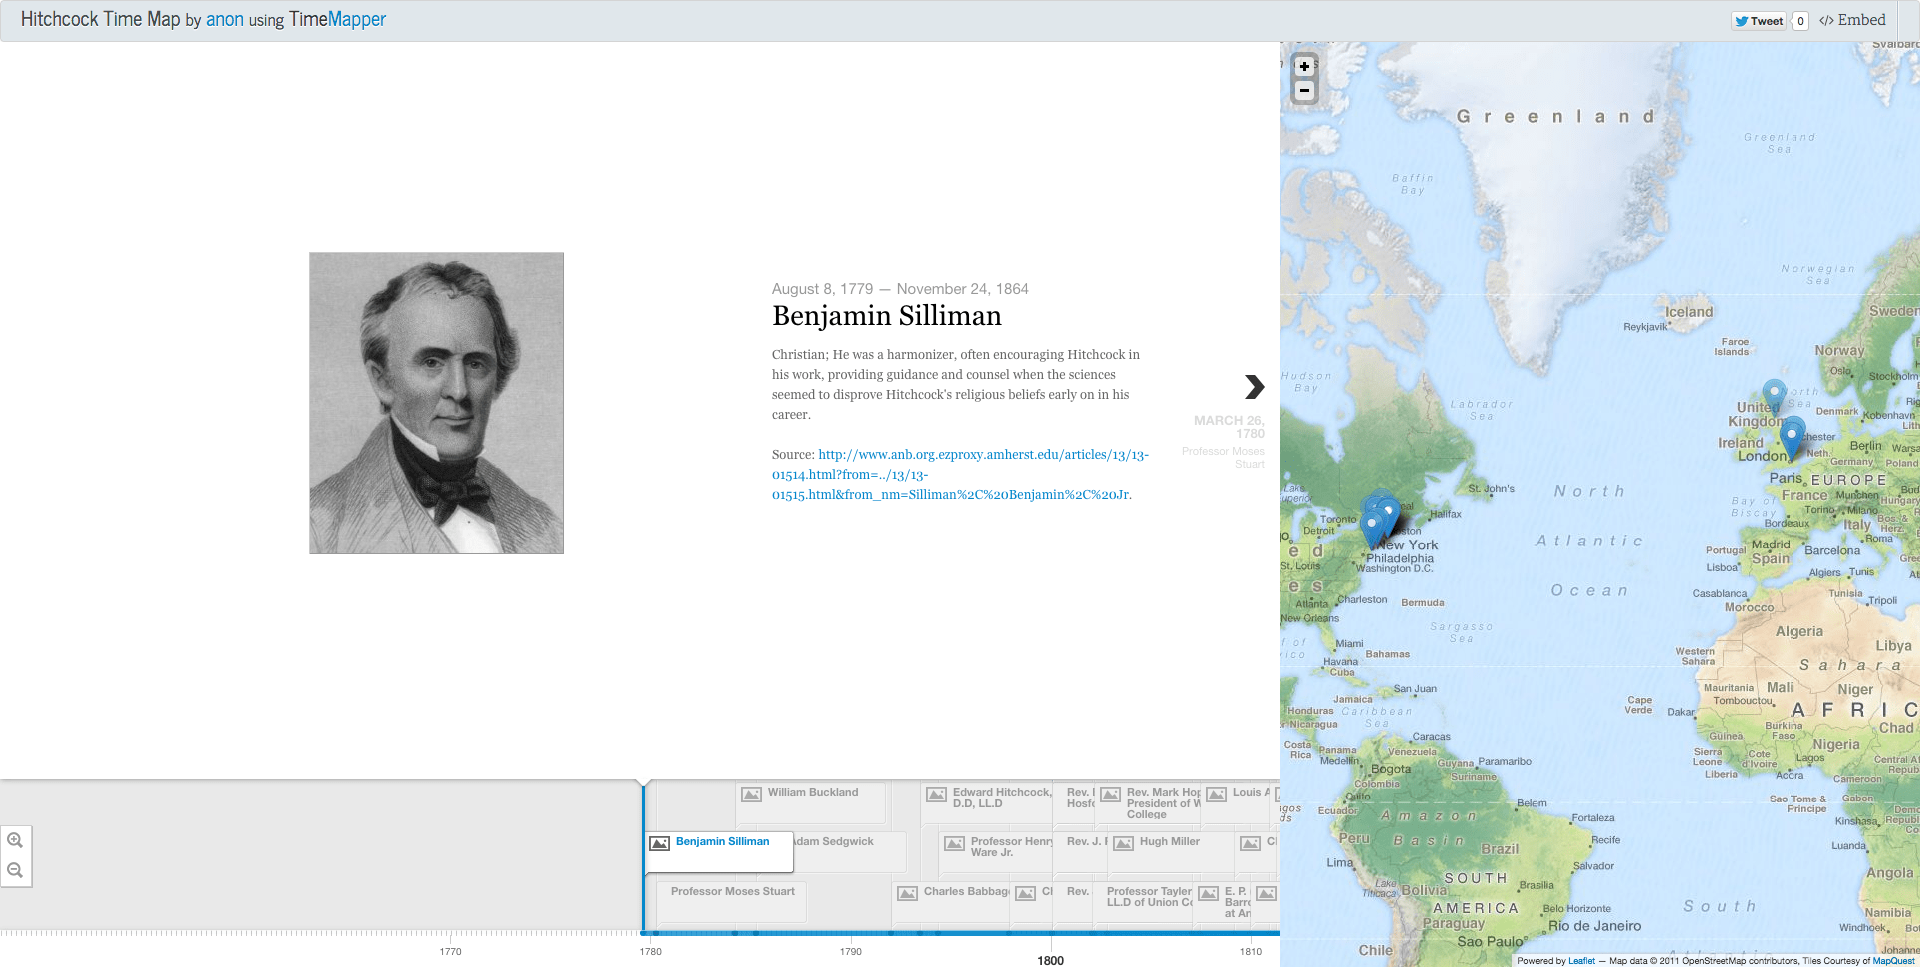
One of the tools which we had had some time to experiment with relatively early on in the internship seemed like a much more appropriate way to include the geographic aspect of my data, without taking away from the larger picture of the content of the conversations. TimeMapper provided me with a more appropriate representation of the data, as it maintained the geographic aspect of “mapping the conversations,” while providing the reader with content about each of the individuals involved in the conversations. While the maps and network that I ended up with were no Stanford project, there are definitely some gold nuggets hidden in what I did come up with. It’s simply a matter of sitting back down in the archives, getting some more information and then crafting yet another research question to find them. How far down the rabbit hole will you go?